Autocorrelation, White Noise, and Box-Cox Transformations
Joe Lee,•time_series

Autocorrelation :
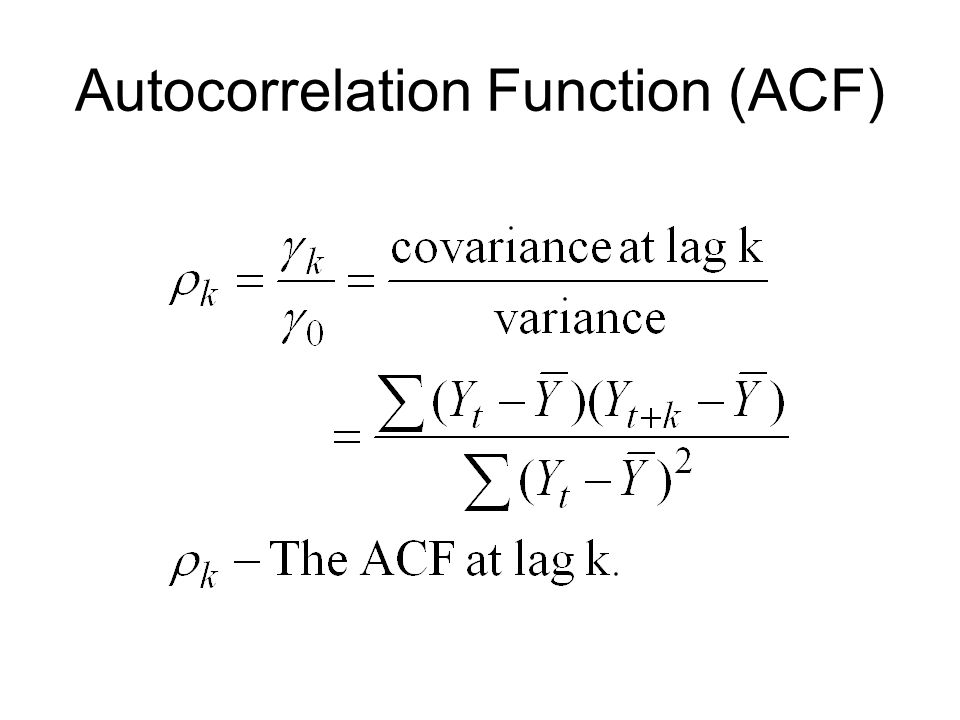
- Correlation measures the linear relationship between two variables; autocorrelation meausre the linear relationship between lagged values of a time series.
- I like the formula used above where I can think of it as the covariance between the lagged value and the variance of itself at time = 0.
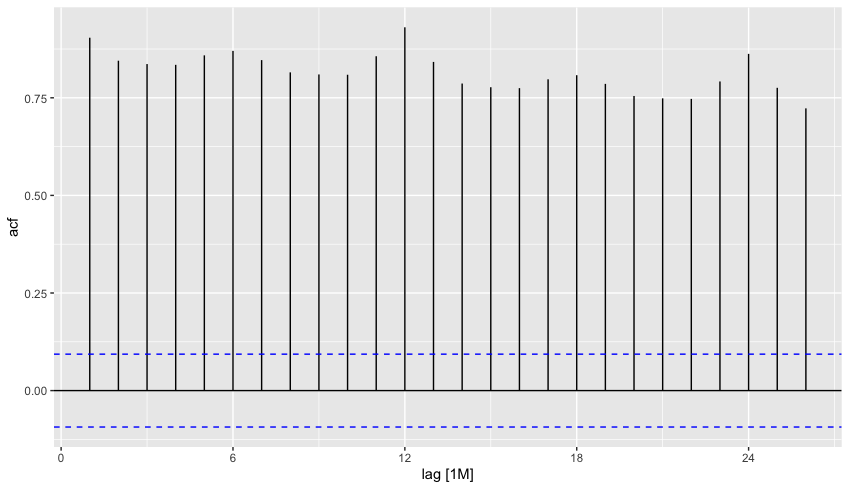
- In R, use
ACF()to get this nice correlogram that plots the correlation at each lag. The blue line represents whether there is a significant correlation at each lag. - The correlogram below displays some sign of seasonality, peaking every 6 months.

White Noise :
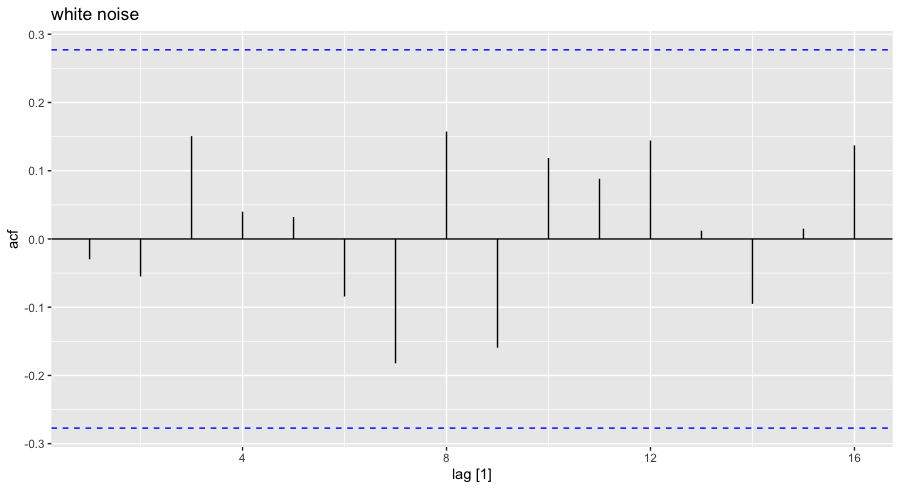
- Time series that display no autocorrelation.
- The correlogram below displays white noise as the correlation for each lag is not significant.
- The auto correlation for white noise is normally distributed with a mean of 1 and a variance of 1/T as we expect all observed correlations to lie in the 95% range. This is a good metric to check whether the data we have is significant or not.

Transformations and Adjustments :
- When dealing with money, values by the CPI in order to account for inflation or an appropriate price index.
- Mathematical tranformations (logs, roots, powers) can be useful in uncovering trends and patterns.
- Log transforms are useful as changes to logs are relative on original scale.
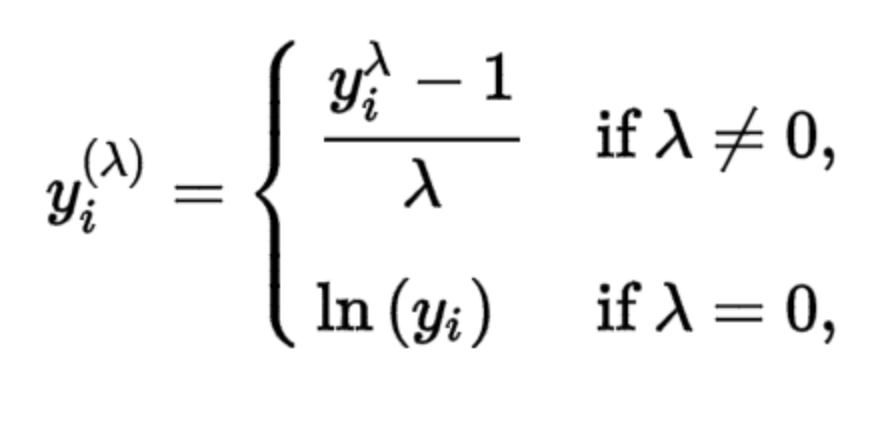
- Box-Cox tranformations help convert non-normal data to normal data. This allows to eliminate skewness and fit better models based on the constant variance assumption.
- use
features = guerroto determine the optimal lambda value for applyingbox_cox()to the dataset. - I need to read more on transformations, especially on Tukey's Ladder of Powers for more detail.
